

axSpA in numbers
Understanding the impact of axSpA on people’s lives
The data generated by IMAS demonstrates how living with axSpA can affect almost every part of a person’s life, from physical and emotional wellbeing to decisions about education, work and relationships.
You can read in more detail about these impacts in our global IMAS report.
0
Total number of participants1,2
55.4% females (n=3080)
44.6% males (n=2475)
2 responses did not indicate male or female
Age range:
18 – 87 years
mean = 44 years
Standard deviation:
11.3 years*
*This means that for the majority of patients symptom onset occurs between 15.4 and 37.8 years2

Mean age at symptom onset 26.8 years2
75 YearsHealthcare professionals visited before diagnosis:2
-
GP
-
Rheumatologist
-
Orthopaedist
-
Physiotherapist
-
Chiropractor
-
Osteopath
-
Other

On average, people visited 2.3 healthcare professionals before diagnosis'2

On average patients experience a diagnostic delay* of7.4 years2
* Diagnostic delay describes the length of time from onset of symptoms to a diagnosis

More than 45% wait 5 or more years for a diagnosis2
Total n = 1652-
9.2% experience
11-15 years delay2 -
13.6% experience 5-7 years delay2
-
16.1% experience >15 years delay2
-
19.7% experience 2-4 years delay2
-
9.3% experience 8-10 years delay2
-
32.2% experience 0-1 years delay2
-
9.2%
-
13.6%
-
16.1%
-
19.7%
-
9.3%
-
32.2%
mean diagnostic delay per country:2
-
 Spain8.5 yearsPrevious country
 -
France6.9 yearsPrevious country
-
Canada9.0 yearsPrevious country
-
Norway10.6 yearsPrevious country
-
UK11.6 yearsPrevious country
-
Turkey4.2 yearsPrevious country
-
Russia6.9 yearsPrevious country
-
India5.1 yearsPrevious country
-
USA8.8 yearsPrevious country
-
Colombia5.7 yearsPrevious country
-
Brazil8.6 yearsPrevious country
-
South Africa10.8 yearsPrevious country
-
Italy5.2 yearsPrevious country
-
Philippines5.8 yearsPrevious country
-
Korea2.0 yearsPrevious country
-
Argentina6.6 yearsPrevious country
-
Taiwan2.9 yearsPrevious country
-
Netherlands7.0 yearsPrevious country
-
Slovenia7.8 years** Data from fewer than 100 peoplePrevious country
-
Austria4.7 years** Data from fewer than 100 peoplePrevious country
-
Switzerland3.5 years** Data from fewer than 100 peoplePrevious country
-
Germany2.7 years** Data from fewer than 100 peoplePrevious country
-
Belgium3.6 years** Data from fewer than 100 peoplePrevious country
-
Sweden7.6 years** Data from fewer than 100 peoplePrevious country
-
Mexico2.9 years** Data from fewer than 100 peoplePrevious country
-
Lithuania6.8 years** Data from fewer than 100 peoplePrevious country
-
Costa Rica0.2 years** Data from fewer than 100 peoplePrevious country
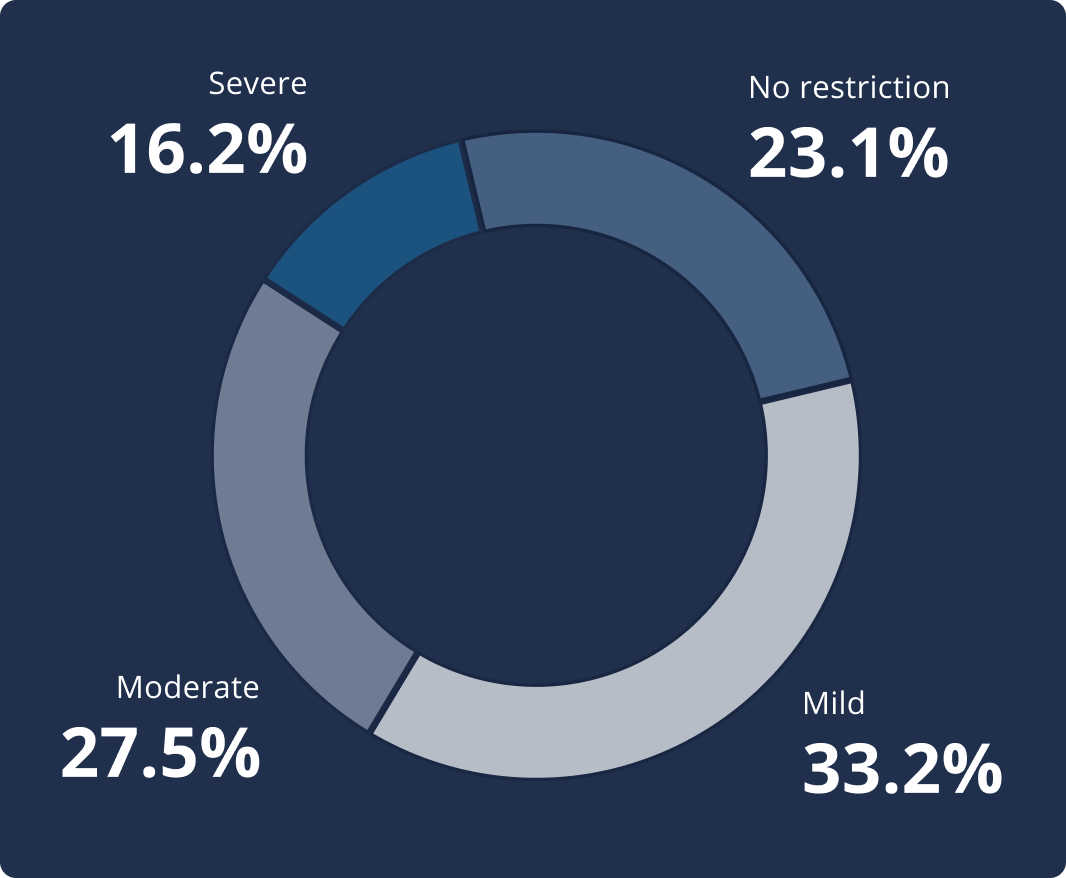
Delay to diagnosis negatively impacts physical health in a range of different ways. People experience higher disease activity, more physical limitations and worse spinal stiffness.
Disease activity is a measure of the ways in which a disease impacts your body. The Bath Ankylosing Spondylitis Disease Activity Index (BASDAI) is a validated, commonly used measure of disease activity for axSpA. It consists of 6 questions answered by patients about how they have felt during the previous week: Fatigue, Spinal pain, Joint pain/swelling, Areas of localised tenderness, Morning stiffness duration, and Morning stiffness severity.
A BASDAI score of below 4 is considered low disease activity, with 4 and above representing sub-optimal control of the disease. The higher the score, the more active and poorly controlled the disease is.
People with longer delays to diagnosis reported higher disease activity.
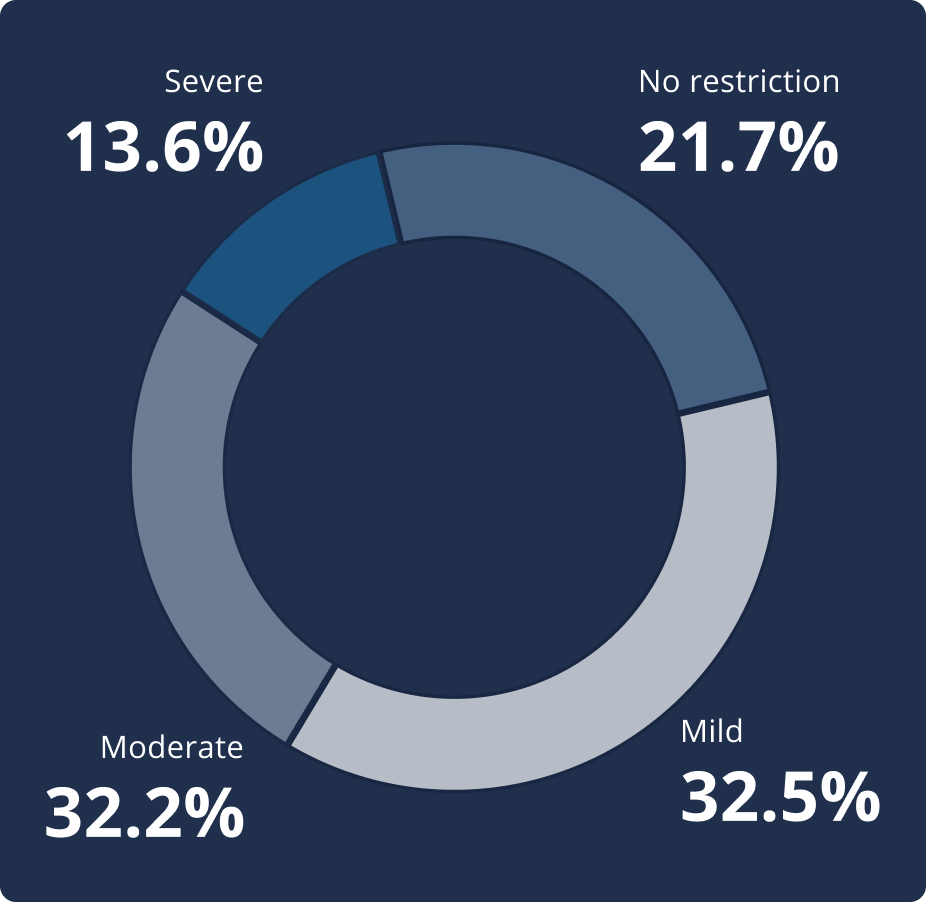
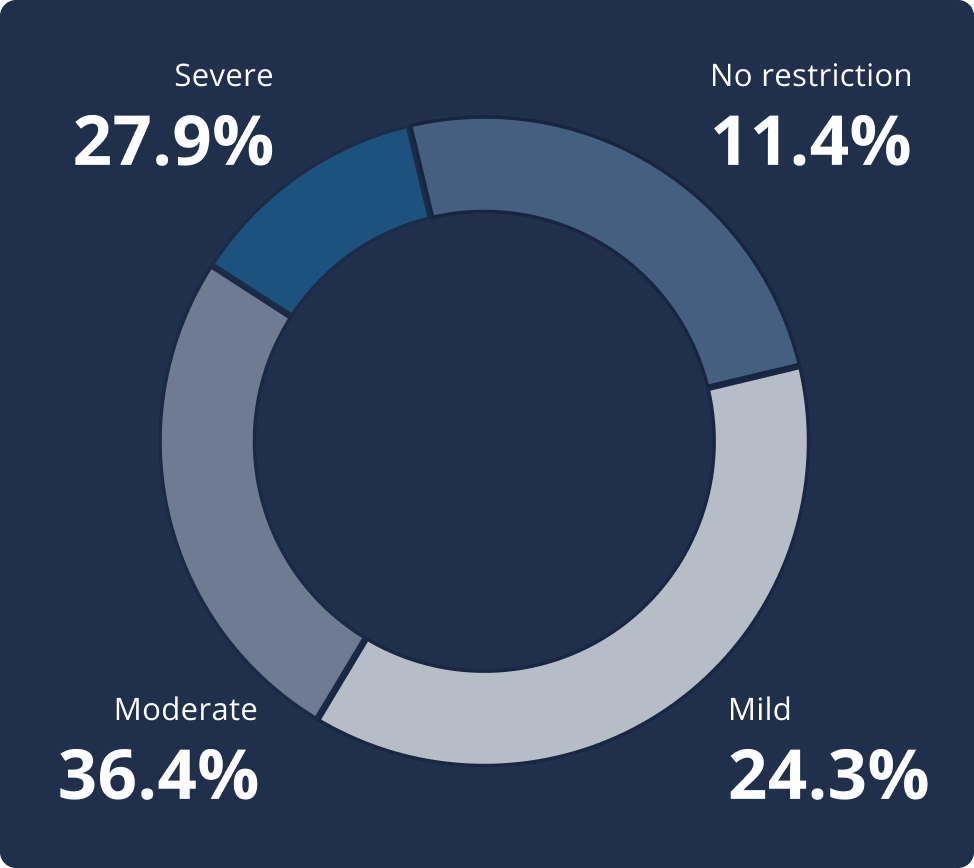
This index, developed specifically for this study, assesses the degree of stiffness experienced by patients in the spinal column, distinguishing between the cervical, dorsal, and lumbar areas. Possible responses range from the least to the most affected column (1, without stiffness; 2, mild stiffness; 3, moderate stiffness; and 4, severe stiffness), total scores are obtained by adding together the responses in each of the areas of the spine without weighting resulting in a scale ranging from 3 to 12. [https://www.ncbi.nlm.nih.gov/pmc/articles/PMC6449283]
A longer delay to diagnosis was associated with greater spinal stiffness and functional limitation.
Functional limitation is a measure of how much axSpA impacts your ability to do daily tasks like tying shoelaces, eating meals and driving.

2 year longer delay for women3
Mean diagnostic delay: 8.5 years (SD: 9.7) for women vs. 6.1 years (SD: 7.8) for men2
mean diagnostic delay per age group:2
-

18-34

3.9
years -
35-51
7.6
years -
52-68
10.3
years -
>68
11.0
years
A BASDAI score of below 4 is considered low disease activity, with 4 and above representing sub-optimal control of the disease. The higher the score, the more active and poorly controlled the disease is.

There are different factors that may influence clinical disease activity but the relationship between these factors is complex and may vary from person to person. Some factors include:5-7


While IMAS cannot draw conclusions on the causal relationship between the different factors and clinical disease activity, our results underline the complexity of this concept in axSpA and highlight the need for a holistic approach in managing the disease.
AxSpA most often leads to pain and swelling in the axial regions of the body (lower back, hips, spine, and sacroiliac joints) but patients also reported swelling and pain in other parts of the body:2

patients report a number of comorbidities:3
-
Sleep disorders 43.4%

-
Anxiety 40.5%

-
Depression 37.2%

- Obesity / overweight 31.4%
- Hypertension 27.5%
- Serious infections requiring antibiotics 20.8%
- Hypercholesterolaemia 20.4%
- Fibromyalgia 19.4%
- Psoriatic arthritis 16.5%
- Irregular heartbeat 16.1%
- Spinal or other fractures 13.2%
Conditions commonly occurring with axSpA3
-
Uveitis 26.7% n=4382
-
Ulcerative Colitis 10.3% n=4382
-
Crohn’s Disease 9.3% n=4382
of patients were at risk of psychological distress2
A General Health Questionnaire (GHQ-12) score higher than 3 signifies risk of psychological distress, for example, depression and anxiety.
- Younger
- Female
- Single / divorced
- Lower income

axSpA flares limited patients’ ability to carry out / engage in everyday activities including:2:
-
 78.7% of patients had limitation when performing physical exercise
 -
 73.3% of the patients had limitations in housework
 -
 68.4% of the patients had limitations when dressing or undressing
 -
 70.6% of the patients had limitations when getting up from bed
 -
 70.6% of the patients had limitations when going up stairs
participants at risk of psychological distress reported:3
- Higher disease activity
- More severe spinal stiffness
- Reduced ability to perform daily activities
Other restricted daily activities reported:2
Tying shoe laces, shopping, walking, intimate relations, driving, cooking, taking a bath,
public transportation, personal grooming, going to the toilet, going to the doctor, eating.
Patients report worsening relationships with:3:
-
45.1%
Colleagues
-
35.1%
Friends
-
31.3%
Spouse or partner
-
23.2%
Family
-
19.3%
Neighbours
-
%
reported that their disease influenced their job choice3
-
%
moved to another job2
-
%
had difficulties finding a job due to the disease3
of employed participants reported that they had suffered work-related issues in the past 12 months
-
Taking sick leave
40.2% -
Missing work for doctor’s appointments
35.6% -
Difficulty in fulfilling work hours
32.7% -
Asking for days off
30.9% -
Reducing work hours
25.3% -
Professional life suffered
15.4% -
Occasionally changing work shift
14.7% -
Had to give up previous job
13.3%
Work-related issues reported2,3:

1 in 3 patients have never discussed treatment goals with their healthcare professional2
the most common treatment goals reported are to:2,3
-
%
Eliminate / reduce pain
-
%
Stop disease progression & structural damage
-
%
Improve mobility
-
%
Improve Quality of Life*
* including mood, sleep, autonomy, ability to work and physical activity
As the severity of disease activity increases, so do the number of annual visits to physiotherapists, family doctors, and other healthcare professionals.
Mean number of annual visits2,3


NSAIDs, Non-steroidal anti-inflammatory drugs; B/tsDMARDS, Biologic and targeted synthetic disease-modifying anti-rheumatic drugs; csDMARDS, Conventional synthetic disease-modifying anti-rheumatic drugs
-
Disease progression
55.9%
-
Suffering pain
55.1%
-
Loss of mobility
48.7%
-
Loss of independence
44.8%
-
Stiffness
42.1%
-
Impact of disease on everyday activities
39.3%
-
Loss of job / inability to work
30.7%
-
Loss of quality of life
26.7%
-
Adverse events due to medication
21.9%
-
Suffering other related diseases
20.7%
-
Medication doesn't work / stops working
18.3%
-
Uncertainty about the future
17.9%
-
Sleep interruptions
17.5%
-
Inability to live with condition / give up
17.2%
-
Anxiety / sadness
17.2%
-
Pass the disease to children
15.6%
-
Financial concerns
15.5%
-
Social isolation
10.9%
-
Complications during pregnancy
9.9%
-
Eliminate pain
54.2%
-
Stop disease progression
51.8%
-
New techniques / drugs to fight disease
42.5%
-
Improve mobility
38.0%
-
Be treated / cured
36.7%
-
Live without constraints / limitations
36.6%
-
Exercise
29.5%
-
Eliminate / reduce stiffness
28.3%
-
Eliminate / reduce flares
25.1%
-
Eliminate / reduce fatigue
23.5%
-
Effective treatment
17.7%
-
Understanding by family members
13.3%
-
Understanding at work by colleagues and superiors
11.2%
References:
- Garrido-Cumbrera M, Poddubnyy D, Sommerfleck F, et al. POS0298 THE INTERNATIONAL MAP OF AXIAL SPONDYLOARTHRITIS (IMAS). RESULTS FROM THE PERSPECTIVE OF 5,557 PATIENTS FROM 27 COUNTRIES AROUND THE WORLD. Annals of the Rheumatic Diseases 2023;82:391-392.
- ASIF data on file
- The burden of axial spondyloarthritis: a global patient perspective, January 2024; Axial Spondyloarthritis International Federation. https://asif.info/imas/imas-global-report
- Garrido-Cumbrera M, Navarro-Compán V, Sommerfleck F, et al. AB1010 WHICH FACTORS ARE ASSOCIATED WITH CLINICALLY HIGH DISEASE ACTIVITY IN AXIAL SPONDYLOARTHRITIS? RESULTS FROM THE INTERNATIONAL MAP OF AXIAL SPONDYLOARTHRITIS (IMAS). Annals of the Rheumatic Diseases. 2023;82:1726-1727.
- Zurita Prada PA, Urrego Laurín CL, Guillén Astete CA, et al. V. Influence of smoking and obesity on treatment response in patients with axial spondyloarthritis: a systematic literature review. Clin Rheumatol. 2021 May;40(5):1673-1686. doi: 10.1007/s10067-020-05319-6. Epub 2020 Sep 3. PMID: 32880827.
- Ramiro S, Nikiphorou E, Sepriano A, et al. ASAS-EULAR recommendations for the management of axial spondyloarthritis: 2022 update. Ann Rheum Dis. 2023 Jan;82(1):19-34. doi: 10.1136/ard-2022-223296. Epub 2022 Oct 21. PMID: 36270658.
- Benavent D, Capelusnik D, Ramiro S, et al. Does gender influence outcome measures similarly in patients with spondyloarthritis? Results from the ASAS-perSpA study. RMD Open. 2022 Sep;8(2):e002514. doi: 10.1136/rmdopen-2022-002514. PMID: 36096523; PMCID: PMC9472201.